
Headline solo and independent travel statistics
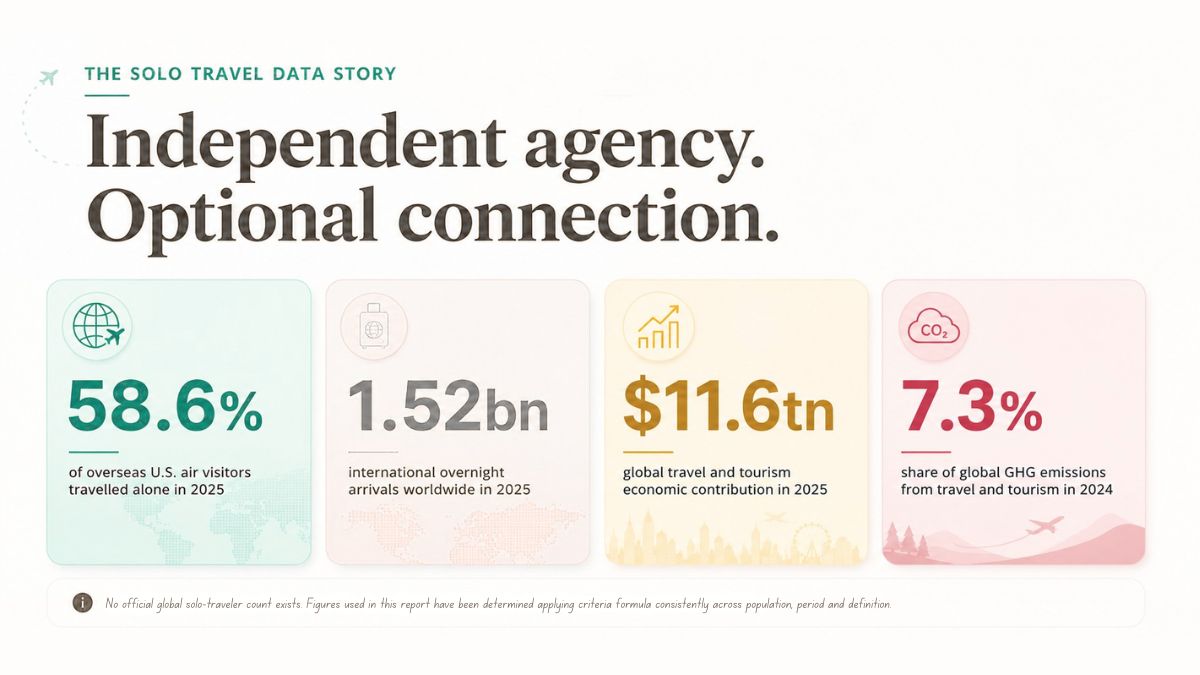
58.6% of overseas visitors arriving in the United States by air travelled alone in 2025. Applied to the 34.3 million overseas visitor base, that implies about 20.1 million party-of-one visitors. The count is a derived estimate, not a published total.
The party-of-one share in the same U.S. series was 59.9% in 2024, so the 2025 share was 1.3 percentage points lower. That does not prove solo leisure demand fell because the survey also includes business and visiting-friends-and-relatives trips.
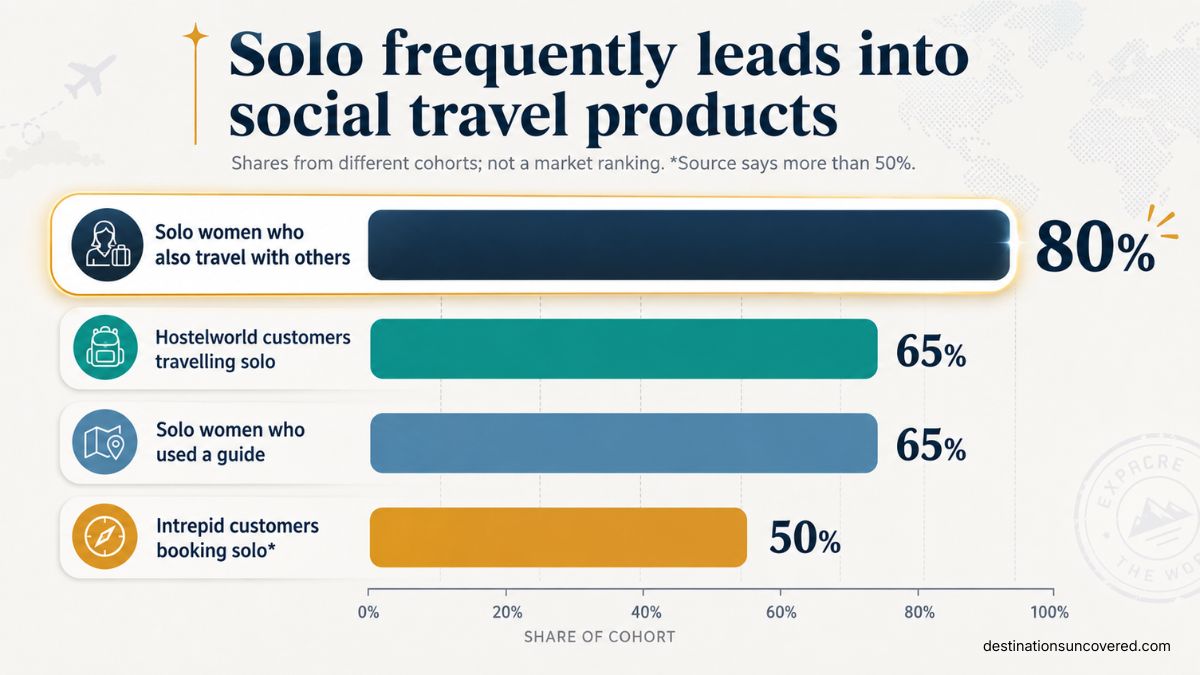
65% of Hostelworld customers travel solo, while 28% travel in pairs. This is a budget-accommodation platform cohort, not the global travelling public.
More than 50% of Intrepid travellers book as solo customers, then join a small-group trip. Solo booking and solitary travel are not the same behaviour
In a 2026 U.S. survey, 50% of adults said they had already travelled solo and a further 32% of non-solo travellers were open to it.
Older adults were more likely than younger cohorts to report prior solo travel in that survey: 64% of the Silent Generation, 58% of Baby Boomers and 50% of Gen X.
Among nearly 2,000 experienced solo women surveyed in 2026, 85% named freedom and flexibility as a motivation; 81% named escape from routine and 76% relaxation or self-care.
In the same community survey, 68% worried about personal safety and 68% about higher costs. Among women who had not yet travelled solo, 73% cited higher costs and 57% safety.
80% of experienced solo women in that survey also travelled with other people. Only 20% described themselves as exclusively solo travellers.
EU residents took 70% of their tourism trips inside their own country in 2024. Domestic travel remains the mass base underneath the international trend story.
EU residents’ outbound trips were about twice as long as domestic trips in 2024: 7.8 nights versus 3.9 nights on average.
International tourism reached 1.52 billion overnight arrivals in 2025, up 4% year on year, with preliminary receipts of US$1.9 trillion.
Travel and tourism contributed US$11.6 trillion to the global economy and supported 366 million jobs in 2025, according to WTTC’s direct, indirect and induced framework.
The sector accounted for 7.3% of global greenhouse-gas emissions in 2024; transport produced 40% of the sector footprint.
What counts as solo or independent travel?
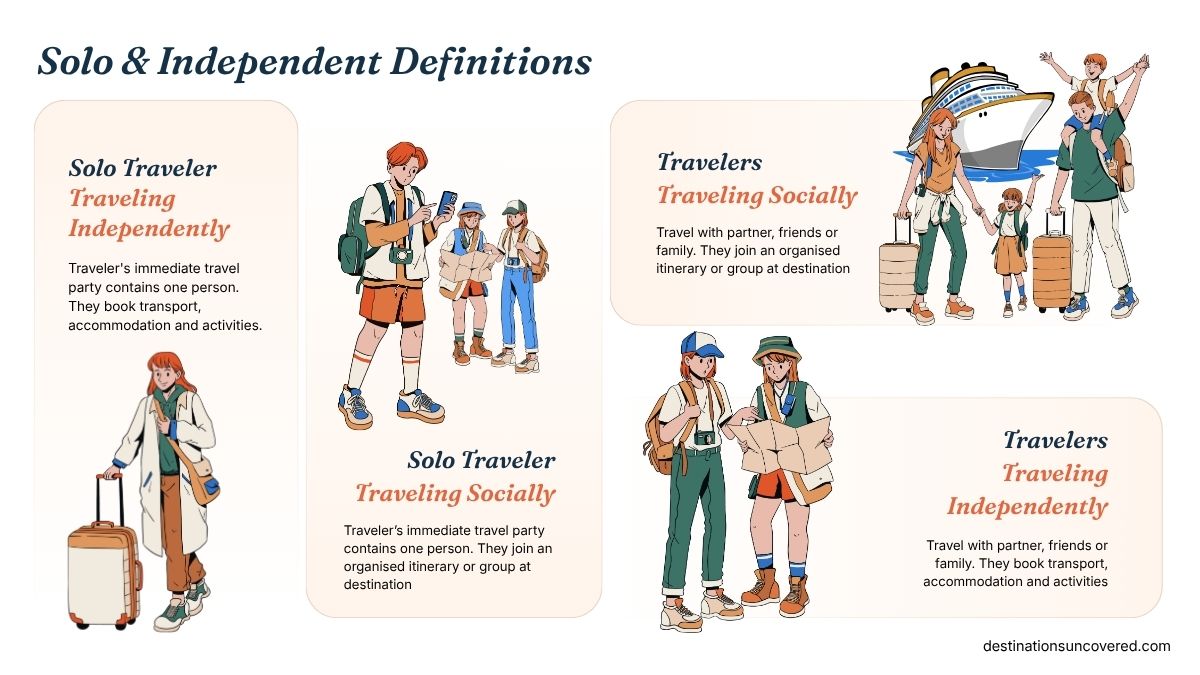
“Solo travel” is used for at least three different behaviours:
- Party-size solo: the traveller’s immediate travel party contains one person. U.S. SIAT uses this type of measure. Solo Traveler Traveling Indepedently
- Independently organised: the traveler books transport, accommodation or activities outside an inclusive package. They may still travel with a partner, friend or family member. Independent traveler
- Solo group-tour customer: the traveller books alone but joins an organised itinerary or group after arrival. Solo Traveler Traveling Socially
The categories overlap, but they are not interchangeable. A business traveler arriving alone, a backpacker using a hostel’s social features and a retired traveler joining a guided programme can all be “solo” in one dataset and not another.
UN Tourism defines tourism around movement outside the usual environment. Eurostat’s resident-trip programme covers overnight trips by residents aged 15 and over and records purpose, destination, duration, booking method, expenditure and demographic variables. The U.S. SIAT goes further by recording party type and size, but its headline outputs still combine leisure, business and visiting-friends-and-relatives travel.
Solo travel is best measured as a trip characteristic, not a permanent traveller identity.
The global destination map independent travelers are moving through
No official regional series isolates solo travellers. The most robust global context is therefore the UN Tourism arrival series for all international overnight visitors.
| Region | 2025 international arrivals | Change vs 2024 | Change vs 2019 | Share of 2025 world arrivals* |
|---|---|---|---|---|
| Europe | 793 million | +4% | +6% | 52.2% |
| Asia and the Pacific | 331 million | +6% | -9% | 21.8% |
| Americas | 218 million | +1% | not stated | 14.3% |
| Middle East | nearly 100 million | +3% | +39% | about 6.5% |
| Africa | 81 million | +8% | not stated | 5.3% |
* Shares are derived from the UN Tourism world total of 1.52 billion. Rounded regional totals do not sum perfectly. Source
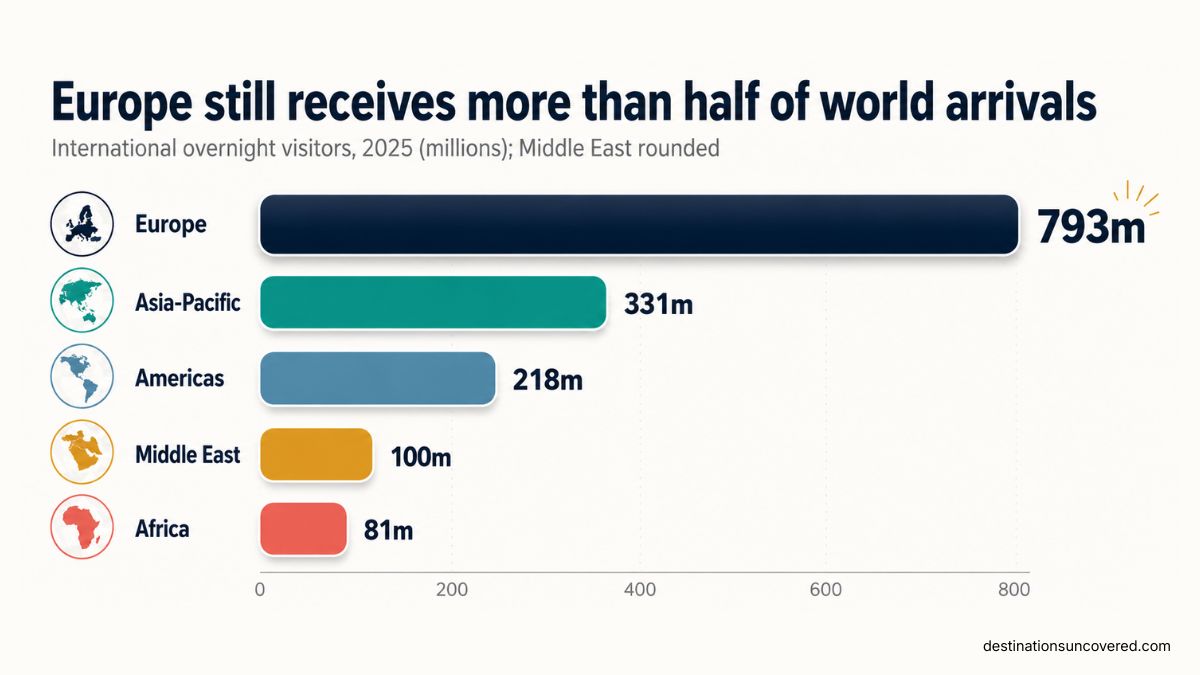
Figure 3. International overnight arrivals by region, 2025. Source: UN Tourism.
Regional story
Europe still receives just over half of the world’s international overnight arrivals. Asia-Pacific is recovering fastest in absolute scale but remained 9% below 2019 in 2025. The Middle East is the clearest structural gainer, almost 40% above 2019. Africa posted the fastest year-on-year regional growth, led by North Africa. The Americas grew only 1%; South and Central America outperformed while the Caribbean was flat and the United States weakened.
This produces a useful editorial distinction:
- Large and growing: Europe.
- Large and still recovering: Asia-Pacific.
- Smaller but structurally above 2019: Middle East.
- Fast percentage growth from a smaller base: Africa.
- Mixed momentum: Americas.
The world’s most visited countries
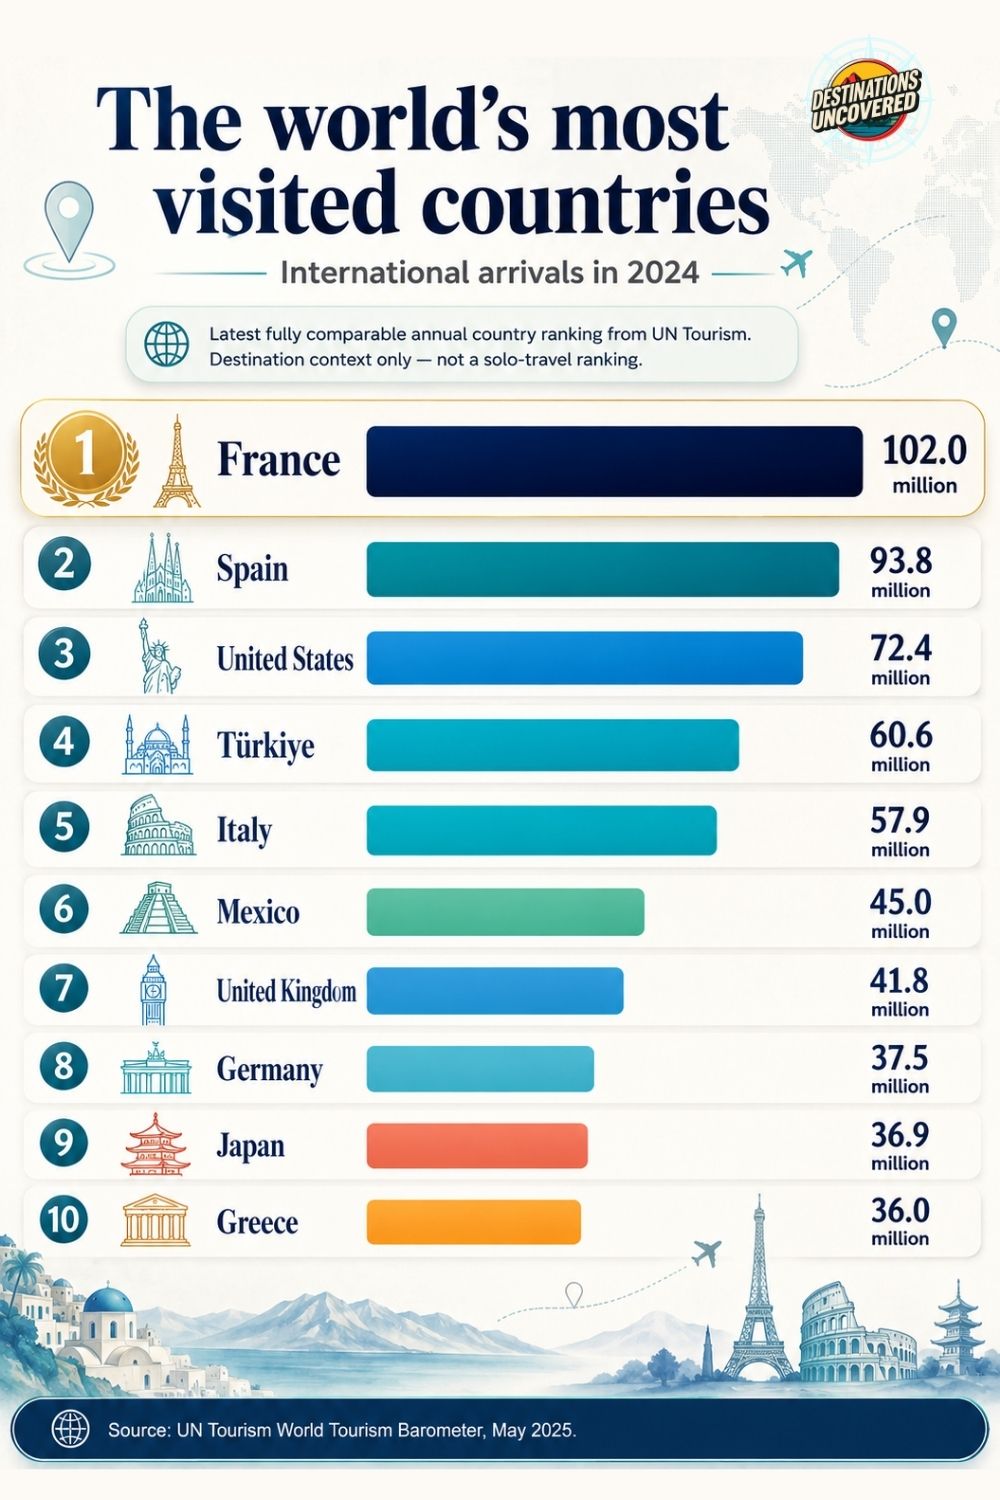
The latest fully comparable annual country ranking available from UN Tourism is for 2024. It is a destination context table, not a solo-travel ranking.
| Rank | Destination | International arrivals, 2024 |
| 1 | France | 102.0 million |
| 2 | Spain | 93.8 million |
| 3 | United States | 72.4 million |
| 4 | Türkiye | 60.6 million |
| 5 | Italy | 57.9 million |
| 6 | Mexico | 45.0 million |
| 7 | United Kingdom | 41.8 million |
| 8 | Germany | 37.5 million |
| 9 | Japan | 36.9 million |
| 10 | Greece | 36.0 million |
Source: UN Tourism World Tourism Barometer, May 2025
Destinations gaining traction
Verified arrival growth in 2025
| Destination | Arrival growth | Reporting window | Evidence class |
| Brazil | +37% | full year 2025 | verified arrivals |
| Egypt | +20% | full year 2025 | verified arrivals |
| Morocco | +14% | full year 2025 | verified arrivals |
| Seychelles | +13% | full year 2025 | verified arrivals |
| Bhutan | +30% | through November 2025 | verified arrivals, partial year |
| Iceland | +29% | through November 2025 | verified arrivals, partial year |
| Guyana | +24% | through November 2025 | verified arrivals, partial year |
| South Africa | +19% | through November 2025 | verified arrivals, partial year |
| Japan | +17% | through November 2025 | verified arrivals, partial year |
Source: UN Tourism 2025 results
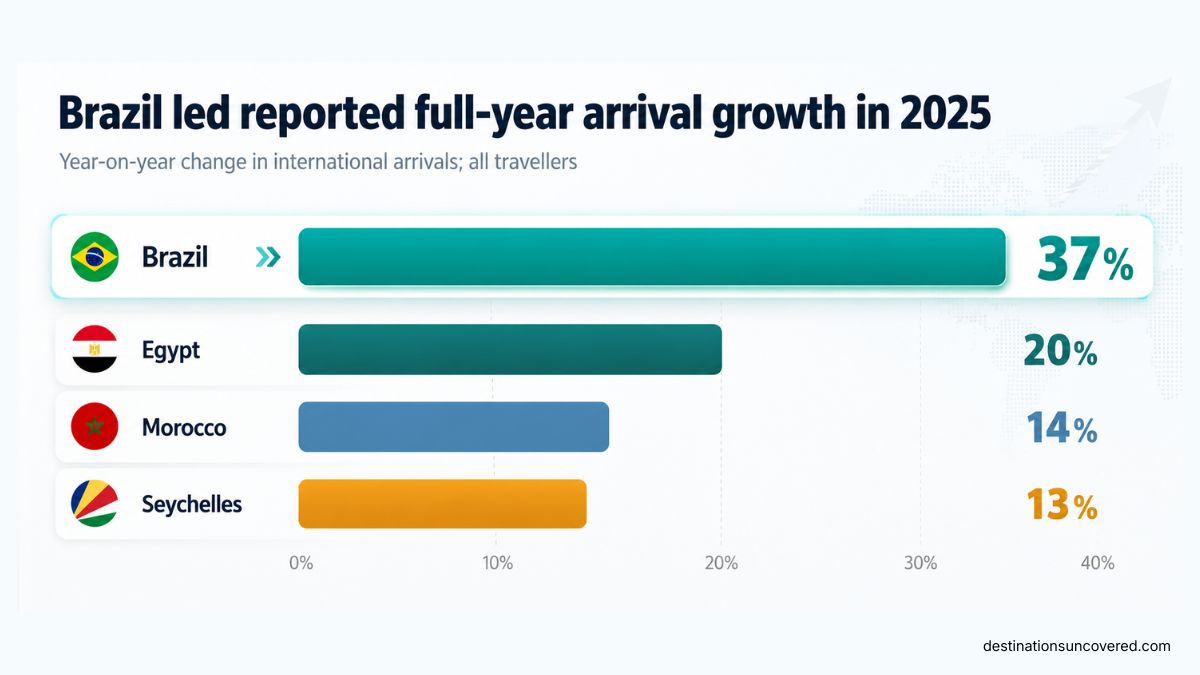
Figure 5: Selected destinations with reported full-year 2025 arrival growth. Source: UN Tourism.
Solo search-interest signals for 2026
Booking.com’s UK search data identified unusually rapid growth for several smaller destinations among solo searches. These figures are useful discovery signals but are highly sensitive to a small starting base and do not represent booked trips or arrivals.
| Destination | Change in UK solo searches | What the number means |
| Moncao, Portugal | +5,288% | search interest, small-base risk |
| Machico, Madeira | +376% | search interest |
| Trapani, Italy | +131% | search interest |
| Porto-Vecchio, France | +99% | search interest |
| Zakynthos Town, Greece | +93% | search interest |
Source: Booking.com UK, summer 2026.
A trending destination is not automatically a growing destination. Search growth measures curiosity; arrivals measure realised trips.
Climate and crowd avoidance
Booking.com reported that 2025 peak-season searches increased 33% for Norway, 29% for Slovenia and 27% for Finland. Its 2026 survey found 43% planned to avoid crowded destinations, 42% planned more off-season travel and 25% expected to choose cooler destinations. The survey and search data cover all travelers, not solo travellers, but they support an emerging shift toward shoulder seasons and cooler alternatives.
Destinations losing momentum
“Losing” needs a precise comparison period. In 2025:
- Asia-Pacific remained 9% below 2019 international arrivals despite strong annual growth.
- Central and Eastern Europe remained 9% below 2019.
- The Caribbean was broadly flat year on year after severe weather disruption.
- The United States recorded about 68.3 million international arrivals, down from 72.4 million in 2024 – a derived decline of roughly 5.7%.
These outcomes do not establish that solo travellers rejected those destinations. Air capacity, border policy, exchange rates, conflicts, disasters and source-market economics can all move the topline.
Country of origin and destination choice
The biggest outbound spending markets
Outbound expenditure is an imperfect proxy for source-market power because it reflects price levels, trip distance and exchange rates as well as traveller numbers. It does show where international travel purchasing power was concentrated in 2024.
| Rank | Origin market | International tourism expenditure, 2024 |
| 1 | China | US$250.6 billion |
| 2 | United States | US$177.8 billion |
| 3 | Germany | US$120.3 billion |
| 4 | United Kingdom | US$119.2 billion |
| 5 | France | US$60.0 billion |
| 6 | Australia | US$45.6 billion |
| 7 | Canada | US$43.4 billion |
| 8 | Russian Federation | US$38.9 billion |
| 9 | Italy | US$35.7 billion |
| 10 | India | US$35.0 billion |
Source: These figures cover all outbound travellers.
Who travelled to the United States in 2025?
The largest overseas air-origin markets were the United Kingdom (4.1 million visitors), India (2.1 million), Japan (2.0 million), Brazil (1.9 million) and Germany (1.8 million). The top destination states were Florida (9.3 million overseas visitors), New York (9.1 million), California (6.6 million), Nevada (2.3 million) and Texas (1.9 million).
The average overseas visitor used 1.4 states. Three quarters visited one state, 14.9% visited two, and 9.7% visited three or more. That is a useful itinerary pattern: even long-haul international visitors usually concentrate rather than tour the whole country.
Domestic proximity still wins
Seven in ten trips by EU residents stayed domestic in 2024. Of their foreign trips, 73% remained inside the EU; Spain, Italy and France together accounted for 46% of foreign tourism nights. This is one of the clearest verified destination-choice patterns: nearby, familiar and transport-connected destinations dominate realised trips even when social media attention is global.
City statistics without a false global ranking
City tourism series use different boundaries and definitions. London reports visits, New York reports total visitors, Dubai reports international overnight visitors, Paris often reports Greater Paris tourists and Singapore is both a city and a country. The figures below are therefore scale examples, not a league table.
| Place | Latest verified measure | Period | Definition note |
| London | 20.9 million international visits; nearly 36 million total visits | 2024 | city visits; 153.8 million visitor nights |
| New York City | 64.3 million total visitors; 13.0 million international | 2024 | city estimate; US$51 billion direct spending and US$79 billion economic impact |
| Greater Paris | 37.4 million tourists expected | 2025 | metro-wide total; estimate, not international-only |
| Dubai | 19.59 million international overnight visitors | 2025 | city-level overnight arrivals, up 5% |
| Singapore | 16.9 million international arrivals | 2025 | city-state; S$32.8 billion tourism receipts |
Sources
In the 2026 Solo Female Travelers community survey, the most frequently named favourite cities were London, Paris, New York, Rome, Barcelona and Tokyo. That is a preference ranking for a self-selected female-solo cohort, not a count of visits.
Age and gender: the stereotype does not survive scrutiny
There is no globally representative cross-tabulation of solo travel by age and gender. The available evidence describes different submarkets:
| Dataset | What it says | What it does not say |
| Hostelworld customers | 80% are aged 18-35; 65% travel solo | not all accommodation users or all solo travellers |
| Road Scholar/Talker Research, U.S. adults | prior solo travel: Silent Generation 64%, Boomers 58%, Gen X 50% | not trip frequency; not a global sample |
| Solo Female Travelers community | safety concern was 82% among Gen Z and 59% among Boomers; older cohorts used and planned more group tours | women-only, self-selected, digitally recruited |
| Shetland 2024 visitor survey | among leisure visitors, 23% of men and 20% of women were in one-person parties | one destination; not a global gender profile |
Sources
This is why the often seen and printed viral statement “84% of solo travellers are women” should not be published as a global fact. A current commercial market estimate puts women at 54.6% of its modelled 2025 solo market, while destination surveys can show near parity. The definitions, commercial modelling and sample frames are too different to reconcile into one global percentage
Older travelers are not a fringe of the solo market. In one 2026 U.S. survey, the likelihood of having traveled solo, and considering traveling solo, increased with age.
Why people travel solo
Among experienced solo women in the 2026 community survey:
- 85% valued freedom and flexibility.
- 81% wanted to escape routine and responsibilities.
- 76% wanted relaxation, self-care or personal time.
- 75% wanted a challenge.
- 58% travelled alone because nobody else was available to go.
The destination-selection factors were culture (78%), beauty (70%), local food (64%), safety (62%), nature (58%), weather (56%), local friendliness (56%), reputation (53%) and value for money (50%).
These figures tell a more useful story than “independence” alone. Solo travel combines agency, restoration, challenge and practical availability.
Solo does not mean socially isolated
The strongest cross-source pattern is hybrid behaviour:
- 65% of Hostelworld customers arrive as solo travellers, on a platform that markets social connection
- More than 50% of Intrepid customers book solo into small-group tours
- 80% of experienced solo women also travelled with other people
- 66% of surveyed solo women tried to meet local people and 65% used a guide at least once
- 53% of U.S. adults in the Road Scholar survey were open to joining other adventurers, and older cohorts expressed stronger interest in group activities
An emerging travel product category is not simply “travelling alone”. It is independent agency with optional connection: private booking decisions, flexible itineraries and chosen moments of social structure.
What solo travel costs
There is no defensible global average trip cost. The following figures measure different things:
| Cost signal | Figure | Coverage |
| Average prepaid trip cost among Squaremouth solo travel-insurance customers | about US$4,200 | insured U.S. platform cohort, trailing 12 months |
| Typical solo travel-insurance policy | about US$250 | Squaremouth cohort; policy commonly 4-10% of insured trip cost |
| Average overseas visitor spend inside the U.S. | US$1,829 | all party sizes, 2025, excludes international airfare |
| Package-holiday single supplement | about GBP462 | UK analysis reported by The Guardian |
| No-single-supplement audit range | 18%-100% | sampled tours, JourneyWoman audit |
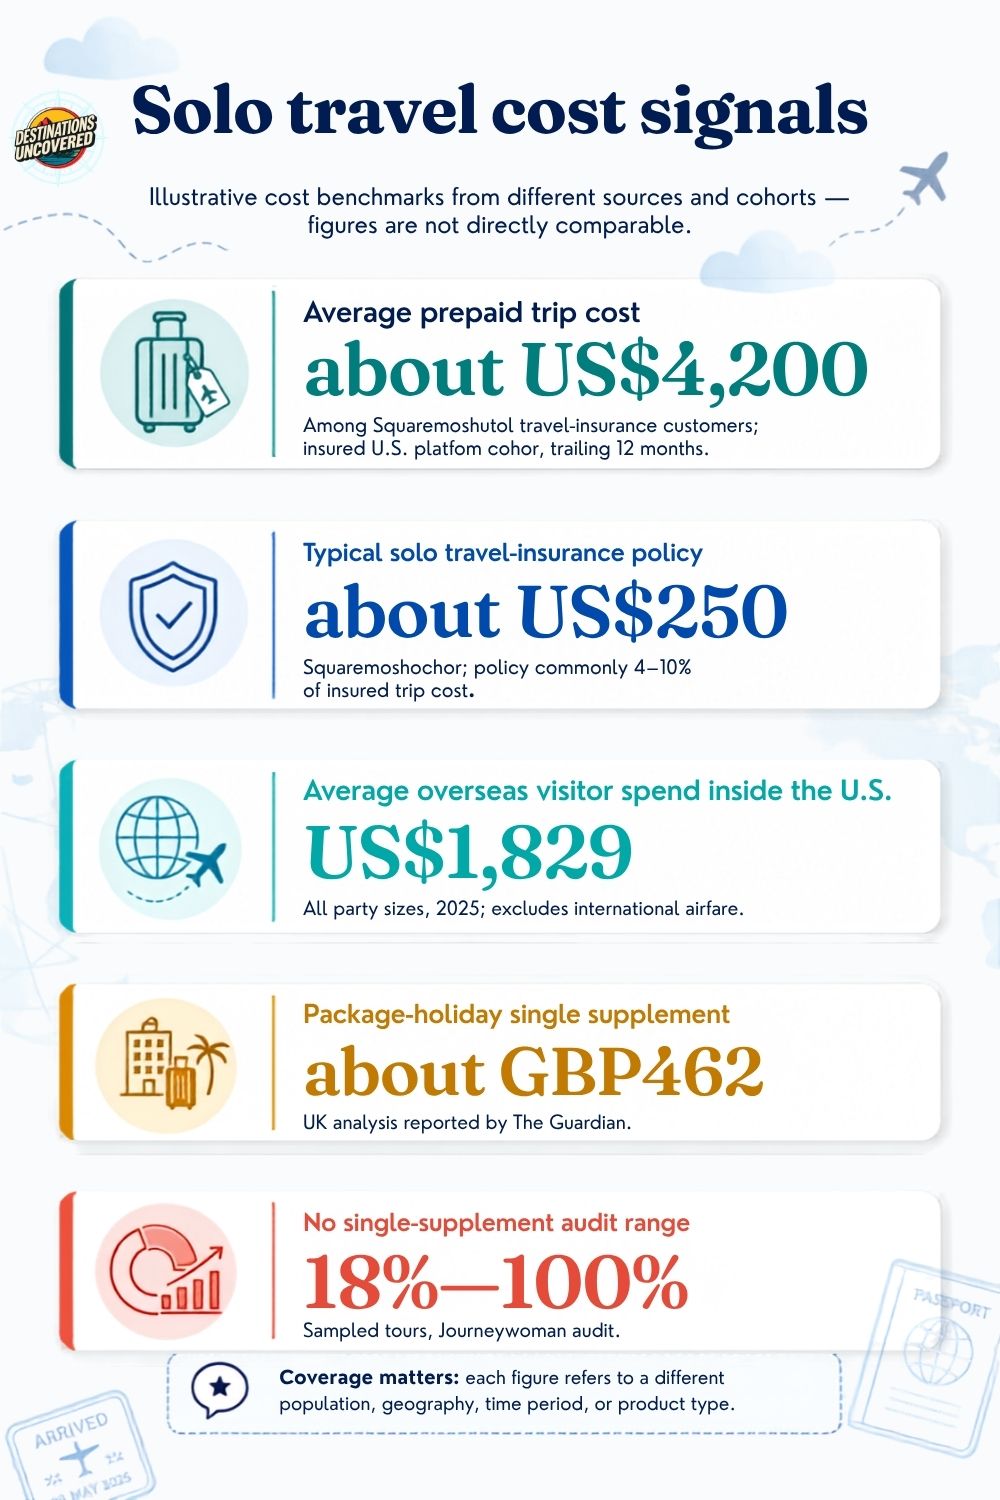
Figure 7: Sources
The “solo penalty” has a structural cause: one person cannot split a double-occupancy room, taxi or rental car. But its size depends on destination, accommodation type, season, product design and whether the cost is quoted per person or per room. A single global percentage would be misleading.
Safety, confidence and planning
In the 2026 Solo Female Travelers survey, 68% of experienced solo travellers worried about safety, but 16% said they had feared for their safety during a solo trip in the previous 12 months and 1% said they had failed to keep themselves safe. Concern is therefore much more common than a reported severe failure of self-protection, though neither figure is a population incident rate
Other planning patterns in that cohort included:
- 57% always bought travel insurance and 51% medical insurance.
- 78% trusted recommendations from friends or family.
- 77% trusted solo-female Facebook groups.
- 61% trusted online reviews and 58% blogs.
- 49% distrusted television, 47% advertising and 35% influencers.
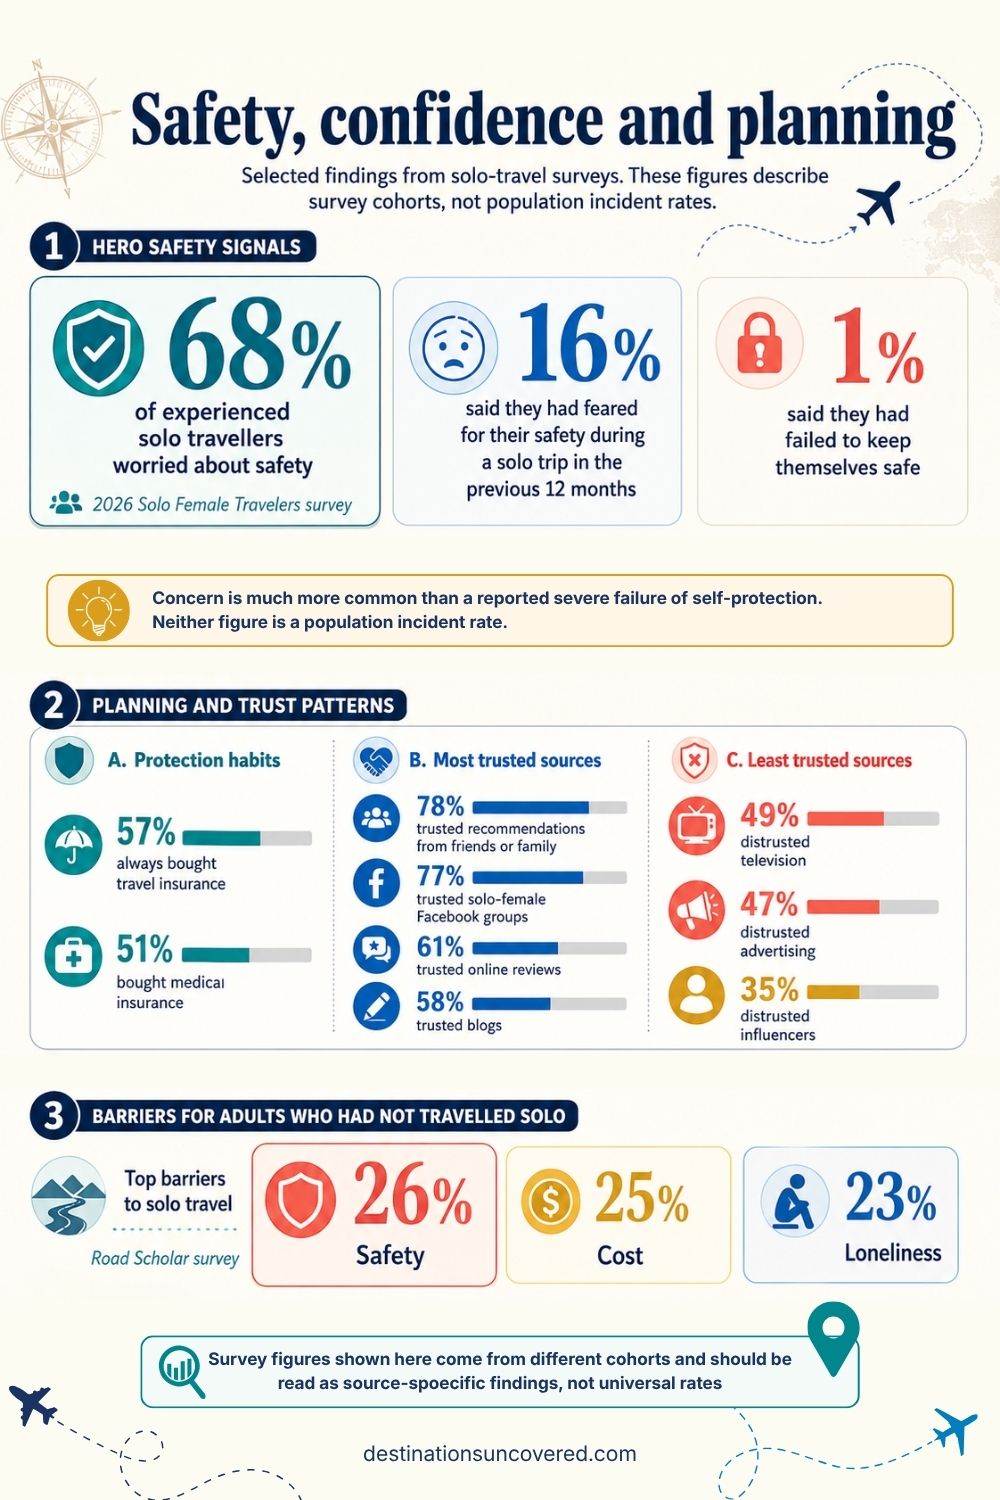
For adults who had not travelled solo in the Road Scholar survey, the most common barriers were safety (26%), cost (25%) and loneliness (23%)
“Cost and safety are the binding constraints; loneliness is usually secondary.”
What solo travellers do at the destination
U.S. SIAT activity data are not solo-only but are useful for party-of-one destination planning because a majority of the visitor base arrived alone. Among overseas visitors in 2025:
- 82.9% shopped.
- 77.8% went sightseeing.
- 33.9% visited national parks or monuments.
- 28.3% visited museums or galleries.
- 27.6% visited small towns or the countryside.
- 34.6% hired a car.
Source.
In the female-solo community survey, 66% tried to meet local people and 65% hired or joined a guide at least once. These behaviours suggest that good solo-travel infrastructure is not limited to hostels: it includes easy local transport, bookable small-group activities, safe public space, flexible dining and trusted information.
Economic gain to destinations
Global contribution
WTTC estimates that travel and tourism contributed US$11.6 trillion to the global economy and supported 366 million jobs in 2025. Its framework includes direct, indirect and induced activity, so it should not be compared directly with visitor spending or tourism receipts.
In 2024, WTTC estimated that travel and tourism generated US$3.5 trillion in global tax contribution, equal to about one tenth of government revenues.
Destination examples
| Destination | Verified economic measure | Period | Accounting boundary |
| New Zealand | NZ$18.1bn international visitor spending; 17% of total exports | year ended March 2025 | Tourism Satellite Account |
| New Zealand | NZ$18.0bn direct tourism value added and NZ$12.56bn indirect value added | year ended March 2025 | Tourism Satellite Account |
| New York City | US$51bn direct visitor spending; US$79bn economic impact | 2024 | destination economic-impact estimate |
| Singapore | S$32.8bn tourism receipts | 2025 | official tourism receipts |
| United States | US$250.2bn international travel and tourism exports | 2025 | balance-of-payments travel exports |
Sources.
These measures answer different questions. Visitor spending is money spent by travellers. Tourism receipts are a cross-border service export. Value added measures contribution to production. Economic impact can include supply-chain and household-spending effects.
Costs imposed on destinations
Tourism’s local benefits can coexist with environmental, housing and infrastructure costs.
Carbon and resource pressure
Travel and tourism accounted for 7.3% of global greenhouse-gas emissions in 2024, down from an 8.3% share in 2019. The sector’s emissions intensity per dollar of economic contribution fell 15%, but transport still produced 40% of its footprint and fossil fuels continued to dominate its energy mix.
The direction is mixed: economic output has decoupled somewhat from emissions intensity, but the absolute footprint remains large.
Housing pressure: Barcelona case study
A peer-reviewed Journal of Urban Economics study estimated that Airbnb activity increased rents by 1.9%, transaction prices by 4.6% and posted prices by 3.7% in the average Barcelona neighbourhood over the study period. In the top decile of Airbnb activity, estimated effects reached 7% for rents, 17% for transaction prices and 14% for posted prices.
This is a local causal estimate, not a claim that every short-term rental market has the same effect. The result is highly place-dependent and strongest in tourism-intensive neighbourhoods.
Visitor levies: Venice case study
Venice’s 2026 access contribution charged day visitors EUR5 when booked early and EUR10 closer to arrival on selected peak dates. Overnight guests, residents and several other groups were exempt. The trial ended on 27 July 2026 and any future continuation requires a new city decision.
The levy illustrates how destinations are trying to price congestion and fund management. It does not prove that a small fee reduces visitor numbers; early reporting indicated stronger revenue effects than crowd-reduction effects.
“Tourism’s economic question is distributional: who receives the gain, who pays the cost and over what time horizon?”
Seven patterns emerging from the evidence
- Solo is becoming modular
Travellers want control over booking and itinerary decisions while adding social contact when useful. Hostels, small-group tours, local guides and activity platforms serve this “independent but connected” model. - Cost and safety are the binding constraints
Across surveys, safety and cost appear more consistently than loneliness. Product design that removes single supplements, improves transport confidence and makes trusted activities easy to book is likely to unlock more demand than messaging about bravery. - Older cohorts matter more than the stereotype suggests
The youth-heavy hostel segment is real, but it is one segment. U.S. survey data show older cohorts were at least as likely to have travelled solo, and older women showed strong interest in group-supported solo experiences. - Domestic travel remains the volume base
International destination content is highly visible, but 70% of EU-resident trips were domestic. Short domestic breaks are a large addressable format for first-time solo travellers. - Small destinations can win discovery before they win arrivals
Huge search-growth rates in Moncao or Machico are meaningful editorial leads, not proof of mass tourism. Publishers should label them as emerging interest and update them when arrival data catch up. - Climate and crowd avoidance are redistributing demand
Cooler destinations and shoulder seasons are gaining attention. This can spread spending geographically and temporally, but it may also transfer overtourism pressure to less prepared places. - The economic story is distributional
Tourism creates exports, jobs, taxes and local business revenue, while also producing carbon, congestion and housing pressure. The question is not whether tourism is simply good or bad, but who receives the gain, who pays the cost and over what time horizon.
Methodology
Inclusion rules
A statistic was included when it had a named source, defined population, identifiable period, measurable geography and a recoverable URL. Primary official sources were preferred. Academic studies were used for causal destination effects. Commercial surveys and platform data were retained only when their cohort was clearly labelled.
Solo and Independent Travel Statistics Exclusion rules
The research excluded unattributed listicles, statistics that cited only another listicle, global market-size claims without a published sampling or modelling framework, and rankings built from incompatible city definitions. Figures were not combined when their accounting boundaries differed.
Derived calculations
Implied 2025 U.S. party-of-one overseas visitors: 34.3 million overseas visitors x 58.6% travelling alone = 20.1 million, rounded to one decimal million.
Regional world-arrival shares: regional arrivals divided by 1.52 billion world arrivals.
U.S. 2025 arrival decline: (68.3 million – 72.4 million) / 72.4 million = -5.7%, rounded to one decimal.
TourRadar 15+ day share: 100% – 26% – 32% – 29% = 13%
Comparability rules
- “Arrivals” and “visitors” are not automatically interchangeable.
- Overnight visitors exclude same-day visitors unless a source says otherwise.
- City figures are not ranked unless boundaries and definitions match.
- Search growth is labelled as search growth, never bookings or arrivals.
- Spend, receipts, value added, GDP contribution and economic impact retain their original accounting labels.
- Solo percentages always carry their dataset-specific definition.
Dataset Download
The dataset used to compile this report and accompanying infographics can be downloaded.
Solo and Independent Travel Statistics FAQ
How many people travel solo worldwide?
No official global series counts solo travellers using one consistent definition. The strongest sources measure party size within a country survey or solo booking within a platform cohort.
Are most solo travellers women?
There is no defensible global percentage. Women are a major and highly visible segment, but published figures come from incompatible women-only surveys, tour operators, accommodation platforms and destination samples.
What is the average solo trip length?
There is no global average. U.S. overseas air visitors stayed 16.9 nights on average in 2025, while TourRadar solo group-tour bookings clustered most heavily in the 7-9 and 10-14 day bands. These are different populations.
What is the average cost of a solo trip?
No one number covers every trip. A U.S. travel-insurance platform reported roughly US$4,200 in prepaid cost for its solo customers, while the average overseas visitor spent US$1,829 inside the United States. Neither is a global average.
Which solo destinations are growing fastest?
Verified 2025 arrival growth was especially strong in Brazil and Egypt, while UK solo search interest surged for smaller places including Moncao and Machico. Arrival growth and search growth should be reported separately.
Does solo travel benefit destinations financially?
Solo-specific destination accounts are rare, but tourism overall creates service exports, value added, jobs and tax receipts. The same activity can also impose carbon, congestion, infrastructure and housing costs.
35 Works Cited
Booking com. Booking.com climate travel research. 2025, news.booking.com/bookingcom-research-reveals-how-climate-uncertainty-is-reshaping-peak-season-travel/.
—. Booking.com UK 2026 summer trends. 2026, news.booking.com/from-child-free-escapes-to-extreme-day-trips-the-trends-redefining-britains-summer-holidays/.
City of Venice. Venice access fee. 2026, cda.veneziaunica.it/en/access-fee.
Clarke, James. Squaremouth solo trip costs. 2026, www.squaremouth.com/travel-advice/how-far-in-advance-should-you-book-a-solo-trip.
Clarke, J. The Solo Travel Guide: Tips for First-Time Adventurers. 2026, www.squaremouth.com/travel-advice/solo-travel-guide.
EconPapers. Do short-term rental platforms affect housing markets? Evidence from Airbnb in Barcelona. 2020, econpapers.repec.org/RePEc%3Aeee%3Ajuecon%3Av%3A119%3Ay%3A2020%3Ai%3Ac%3As0094119020300498.
Eurostat. Eurostat top destinations. 2024, ec.europa.eu/eurostat/statistics-explained/index.php?title=Tourism_statistics_-_top_destinations.
—. Trips of EU residents – annual data. 2024, ec.europa.eu/eurostat/cache/metadata/en/tour_dem_esms.htm.
—. Eurostat Tourism statistics. 2025, ec.europa.eu/eurostat/statistics-explained/index.php?title=Tourism_statistics.
—. Eurostat trip characteristics. 2025, ec.europa.eu/eurostat/statistics-explained/index.php?title=Tourism_statistics_-_characteristics_of_tourism_trips.
Government of Dubai Media Office. Dubai 2025 tourism results. 2025, www.dubaidet.gov.ae/en/newsroom/press-releases/dubais-tourism-industry-achieves-third-successive-record-breaking-year.
Grand View Research. Grand View solo market estimate. 2025, www.grandviewresearch.com/industry-analysis/solo-travel-market-report.
Greater London Authority. The State of London Report 2025. 2025, data.london.gov.uk/blog/the-state-of-london-report-2025.
Hostelworld. Hostelworld key facts. 2025, www.hostelworldgroup.com/media/key-facts.
—. Hostelworld key facts. 2025, www.hostelworldgroup.com/media/key-facts.
International Trade Administration. Survey of International Air Travelers Results 2024 (U.S. NTTO 2024 SIAT). 2024, www.trade.gov/feature-article/survey-international-air-travelers-results-2024.
—. Survey of International Air Travelers – U.S. NTTO SIAT methodology. 2025, www.trade.gov/survey-international-air-travelers-siat.
—. Survey of International Air Travelers Results (U.S. NTTO 2025 SIAT). 2025, www.trade.gov/feature-article/2025-survey-international-air-travelers-results.
—. U.S. NTTO forecasts. 2025, www.trade.gov/travel-and-tourism-forecasts.
—. U.S. Travel and Tourism Exports and Imports in December 2025. 2026, www.trade.gov/feature-article/december-2025-international-visitor-spending.
Intrepid. Intrepid solo travel. 2026, www.intrepidtravel.com/us/solo-travel.
NYC Tourism. NEW YORK CITY TOURISM ON TRACK TO FINISH 2024 WITH $79 BILLION IN ECONOMIC IMPACT AND $51 BILLION IN DIRECT SPENDING ACROSS THE FIVE BOROUGHS. 2024, www.business.nyctourism.com/press-media/press-releases/NYC-Tourism-year-end-tourism-numbers-2024.
Official website Paris je t'aime. Barometer August 2025. 2025, parisjetaime.com/eng/media/article/barometer-august-2025-a1901.
Ray, C. Why the Outdated Practice of “No Single Supplement” is Slowing Down Solo Travel — And What Women Can Do About It. 2025, journeywoman.com/solo-travel-advice/budget-travel/why-the-outdated-practice-of-no-single-supplement-is-slowing-down-solo-travel-and-what-women-can-do-about-it/.
Road scholar. Road Scholar solo travel survey. 2025, www.roadscholar.org/blog/what-holds-older-adults-back-from-solo-traveling/.
Shetland Islands Council. Shetland 2024 Visitor Survey. 2024, www.shetland.gov.uk/downloads/file/10660/2024-visitor-survey.
Singapore Tourism Board. Speech by Ms Melissa Ow, Chief Executive, Singapore Tourism Board, at the Tourism Industry Conference 2026. 2026, www.stb.gov.sg/about-stb/media-publications/speeches/speech-by-ms-melissa-ow–chief-executive–singapore-tourism-board–at-the-tourism-industry-conference-2026/.
solo female travelers club. Solo Female Travelers 2026 survey. 2026, www.solofemaletravelers.club/solo-female-travel-stats/.
Stats NZ. Tourism satellite account: Year ended March 2025. 2025, www.stats.govt.nz/information-releases/tourism-satellite-account-year-ended-march-2025/.
TourRadar solo tours. Group Tours & Trips for Solo Travelers. 2025, www.tourradar.com/s/solo.
UN Tourism. Source: UN Tourism World Tourism Barometer, May 2025. 2025, www.unwto.org/un-tourism-world-tourism-barometer-data.
—. UN Tourism 2025 results. 2025, www.untourism.int/news/international-tourist-arrivals-up-4-in-2025-reflecting-strong-travel-demand-around-the-world.
—. Glossary of Tourism Terms. 2026, www.untourism.int/glossary-tourism-terms.
WTTC. WTTC Economic Impact Research. 2025, wttc.org/research/economic-impact.
—. WTTC Environmental & Social Research. 2025, wttc.org/research/environmental-social.